Tornado risk overview – Storm Prediction Center
The key things to know from the experts. Select images for more info at the source.
Today’s tornado probabilities

The probability of a tornado within 25 miles of a point. If a hatched area is included in the image, which is only done with probabilities of 10 percent or higher, strong tornadoes are more of a concern than normal. The following tornado probabilities correspond to each SPC storm risk category.
2%, Marginal | 5%, Slight | 10%, Enhanced | 15%, Moderate | 30%+, High | Hatch = greater EF2+ tornado risk
Current outlook areas, radar, and convective watches

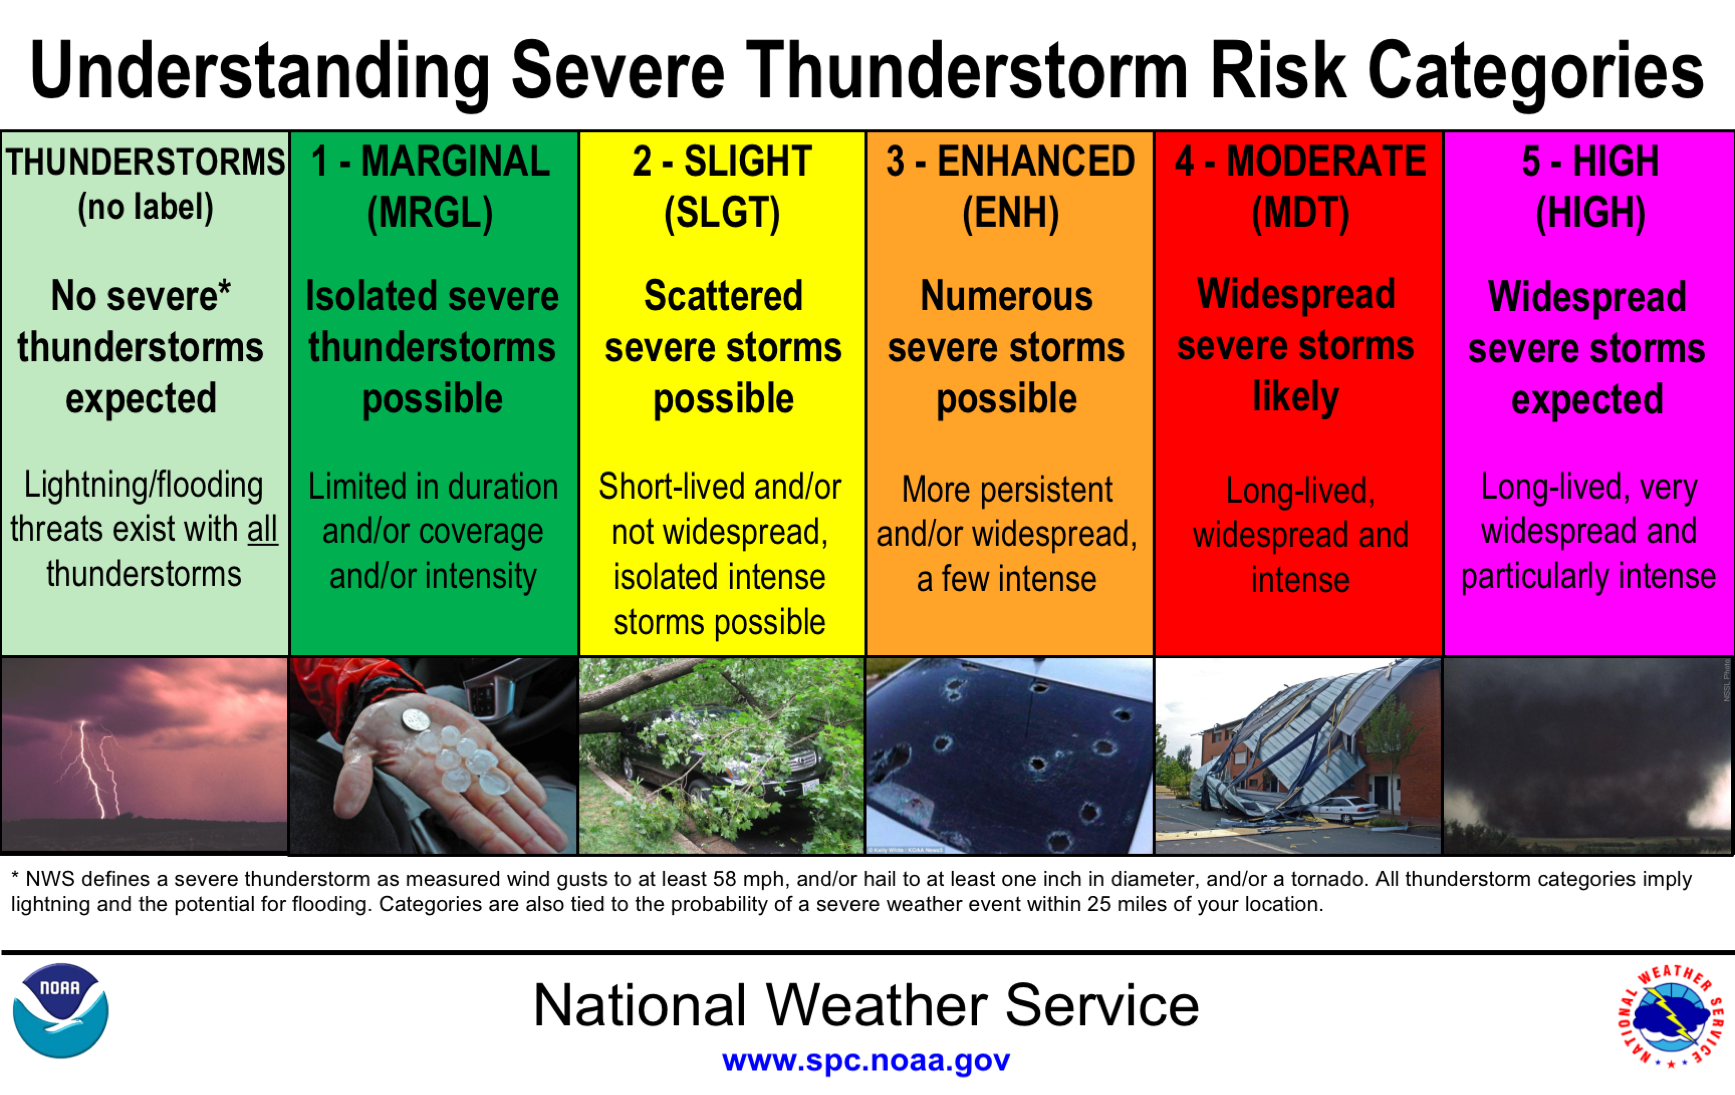
Organized risk of severe storms begins with “marginal” (MRGL). Levels increase to “slight” (SLGT), then “enhanced” (ENH), then “moderate” (MDT), and finally “high” (HIGH). SPC has a graphic covering the differences.
Watches, either tornado watches or severe thunderstorm watches, indicate that storms are likely to pose the highlighted threat. Tornadoes can also occur in severe thunderstorm watches.
The days ahead
Tomorrow’s severe weather outlook

Day 3 severe weather outlook

Satellite
Viewing storms from space
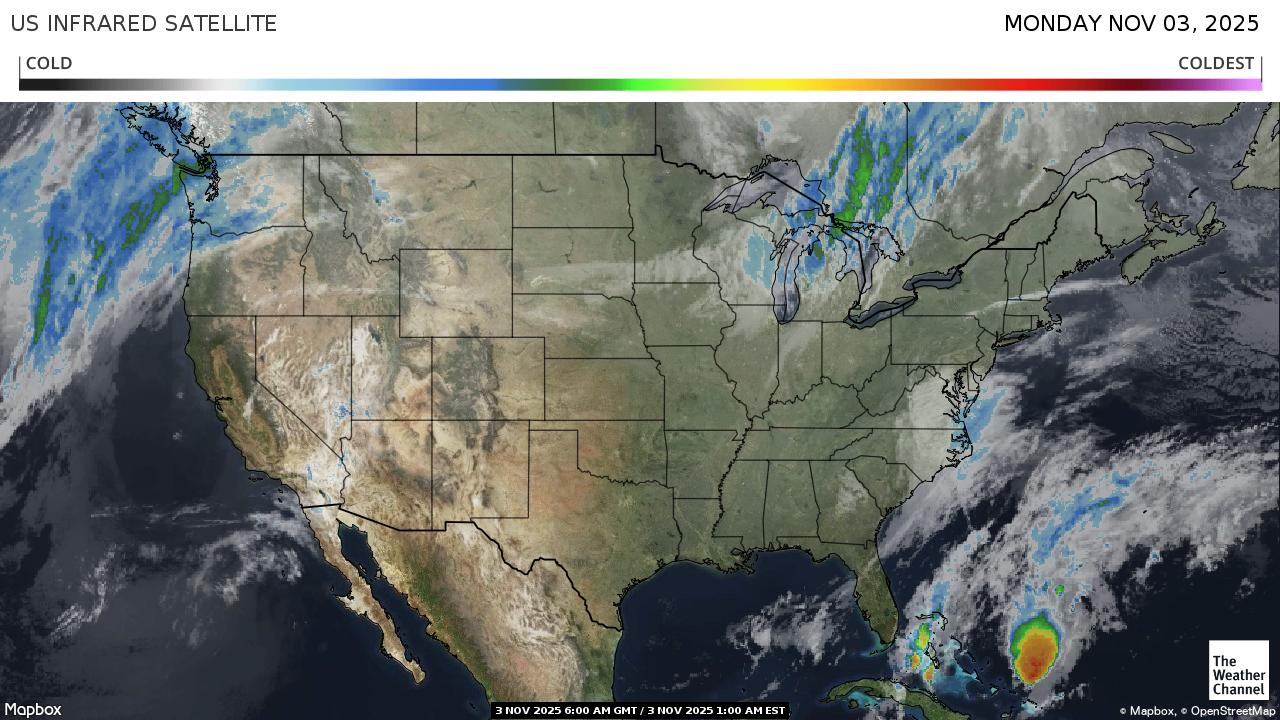
NASA Regional Viewer | GOES 1-minute imagery
Current surface conditions
A look at the key environmental factors
U.S. surface features
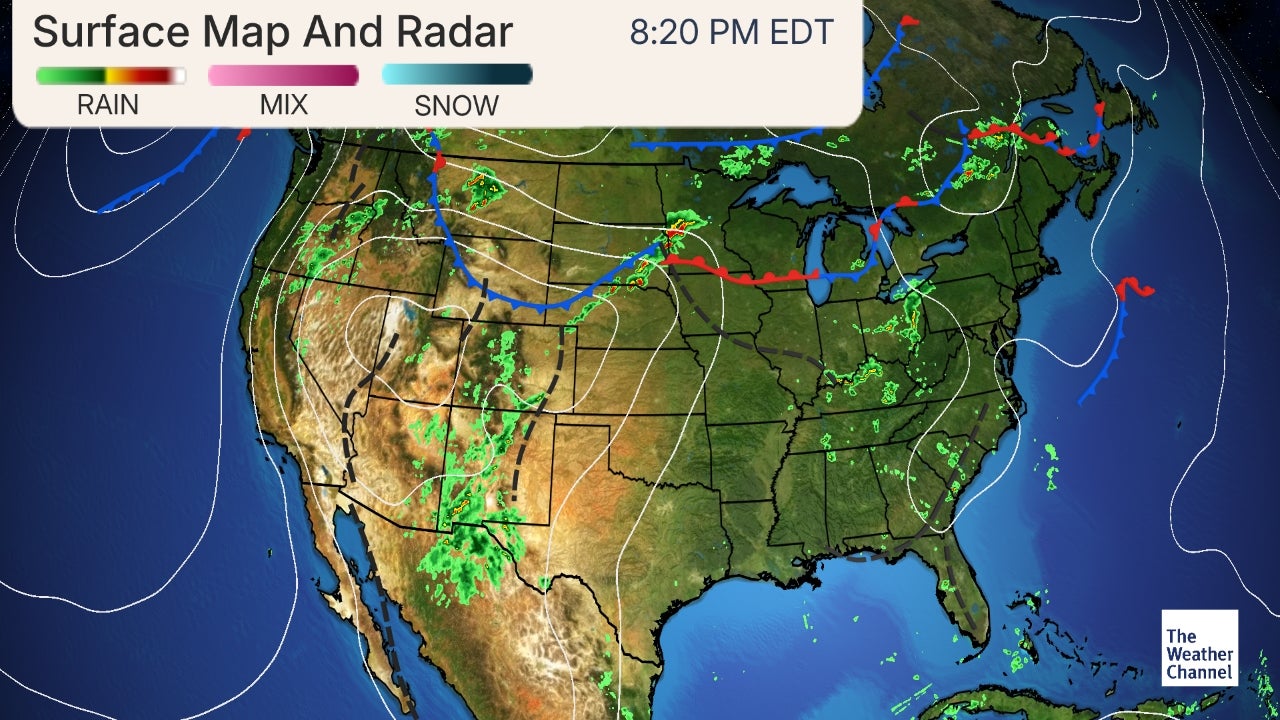
A surface feature analysis often tells the basic story of any weather setup. High pressure usually means calmer weather, while low pressure is often associated with stormier conditions.
SPC mesoanalysis pressure plot
U.S. observations, including wind speed and direction
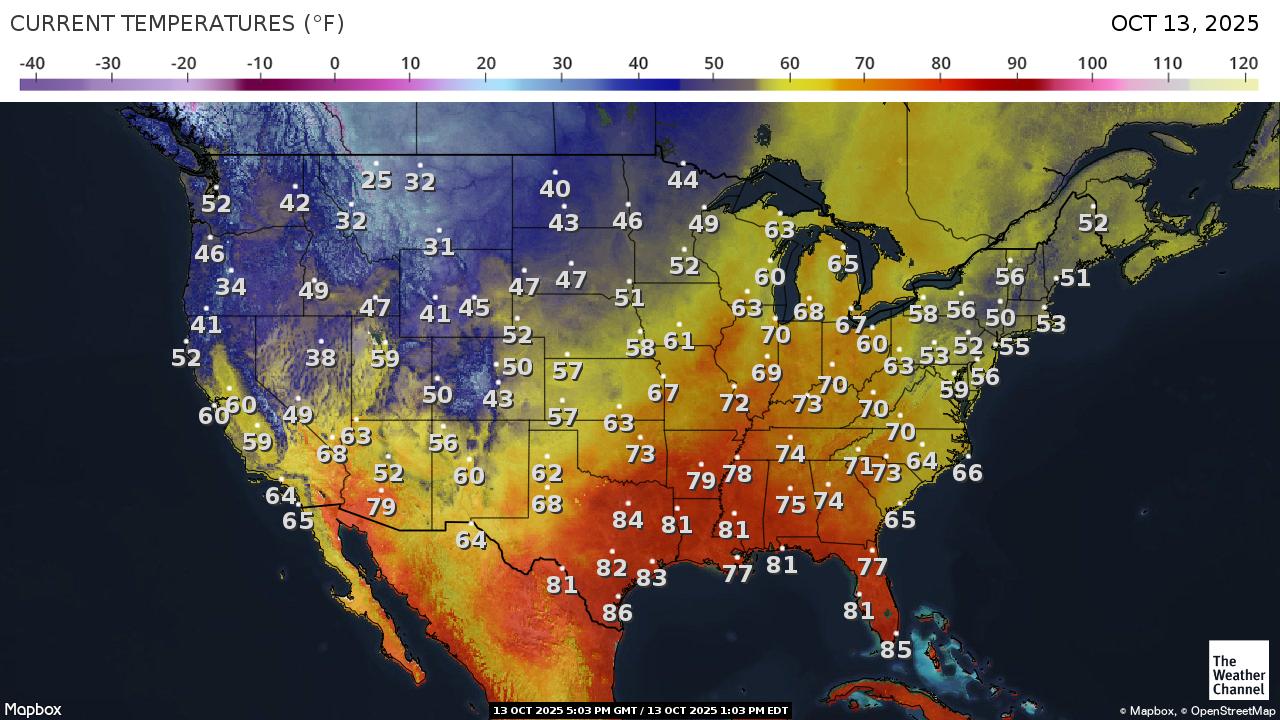
U.S. temperatures
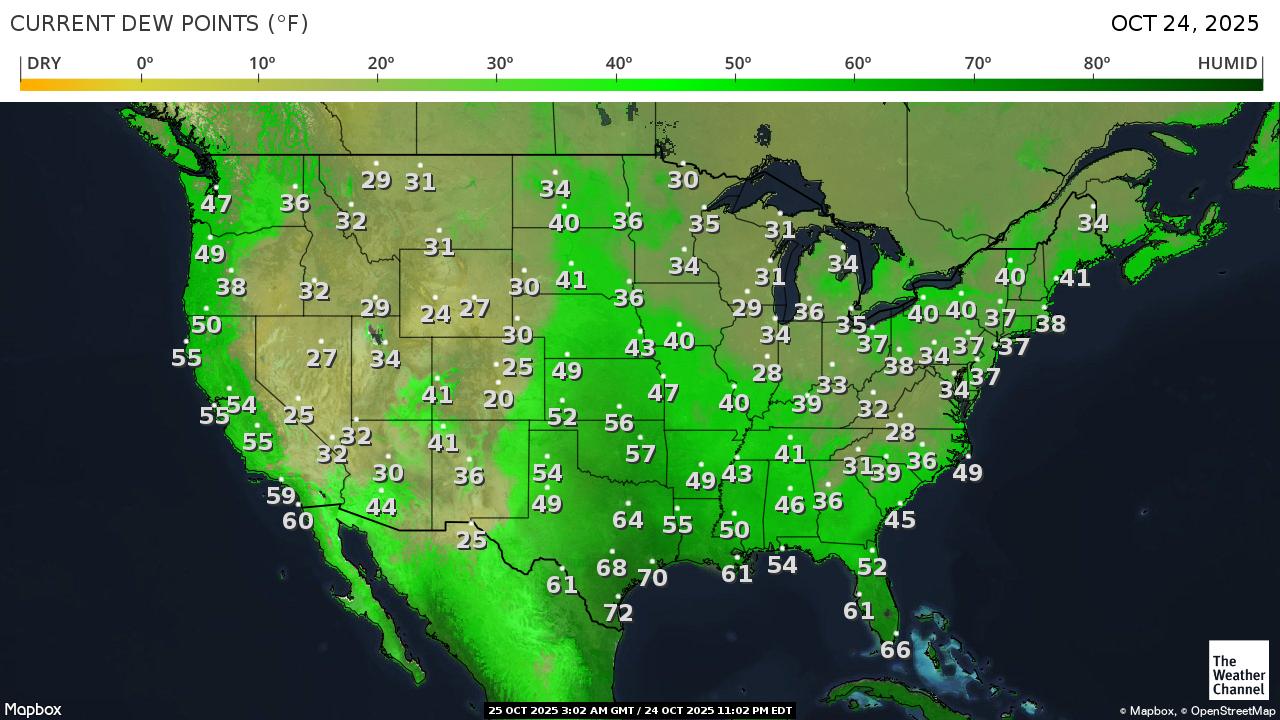
U.S. dewpoints
Key tornado indices via the Storm Prediction Center
These indicators are among the best
Surface-based CAPE

Bulk shear
Supercell composite
Significant tornado parameter
Surface–1 km EHI

LCL height
